Survey Analysis |
|
|
By: Vivek Bhaskaran
CEO, QuestionPro |
|
Analyzing data from online surveys is probably one of the most interesting aspects of the whole "Online Survey" experience. It is important to understand the "Numbers" before you can claim your research to be successful. In this artice we will provide you with the different analysis options available and what they really mean.
At QuestionPro we offer a couple of analysis tools that make data analysis incredibly easy: -
Note: Not all analysis tools maybe available for all the licenses.
I. Basic Frequency Analysis
This gives you an "Overall" insight into the responses for your survey. General questions like :-
To access the data, click on View Results Tab.
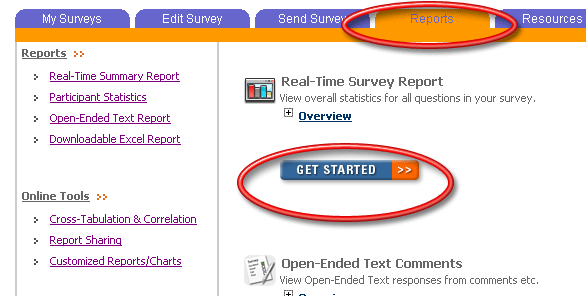
Then choose the question you are interested in...
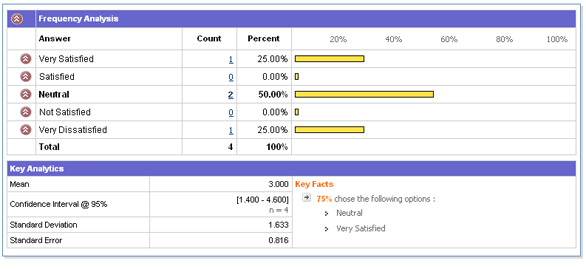
Then view the analysis data! It is as simple as that!
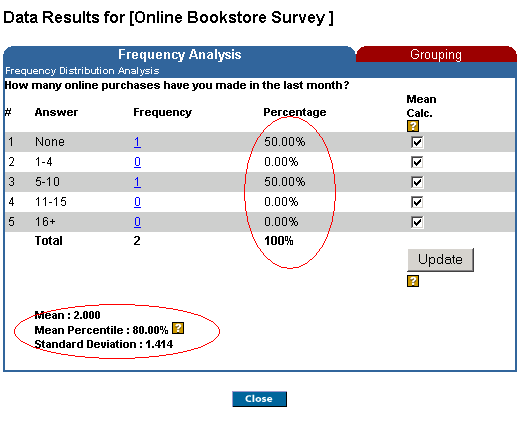
This is the First level for your analysis. This gives you an "overall" impression of what your respondents are thinking. In the subsequent sections we'll do some data-mining and in-depth analysis.
II. Cross Tabulation Analysis (Banner Tables)
Crosstabs give you more insights into your data. Crosstabs answer questions like: -
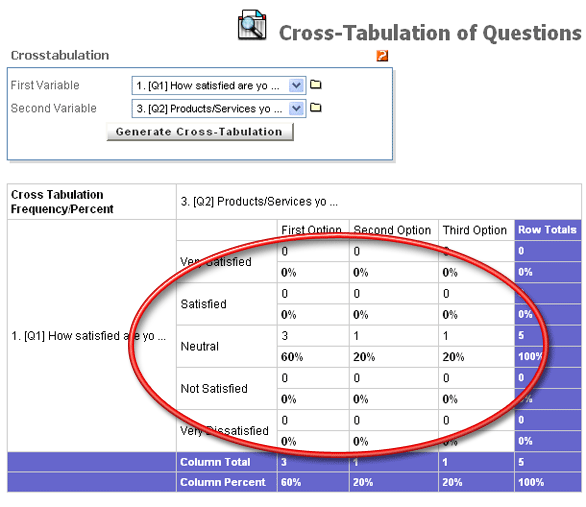
It basically involves the interaction between two questions and a distribution of how users responded to both of them -- taken together.
Cross-Tabs
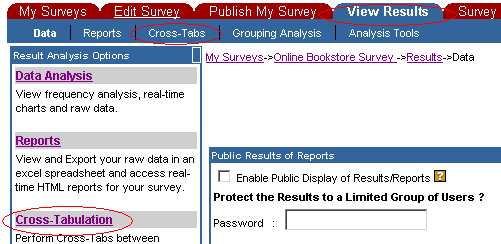
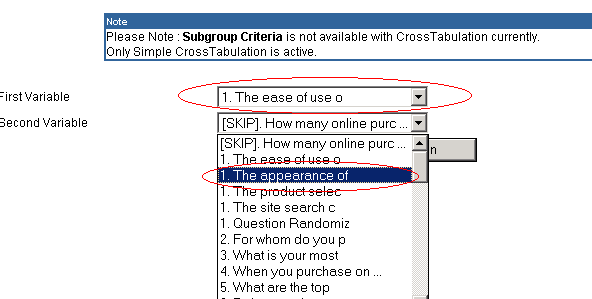
Choose the two questions you'd like analysis done...
View the data!
III. Grouping and Segmentation Analysis
Grouping analysis is probably the most interactive tools to "delve" into your data. You can create custom groups or filters. For example: -
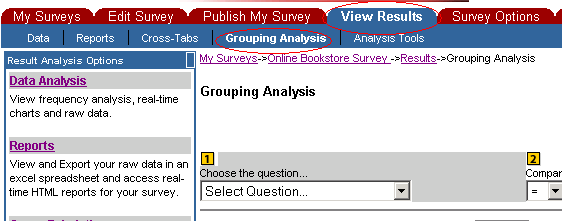
To access grouping analysis, click in View Results->Grouping Analysis
Create your groups and filters...
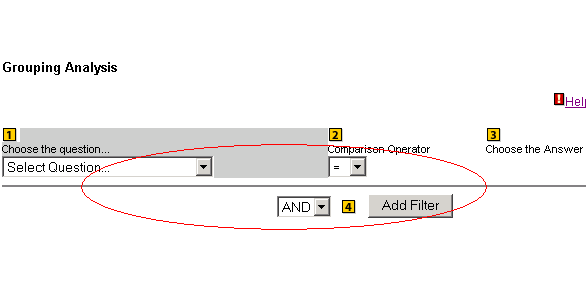
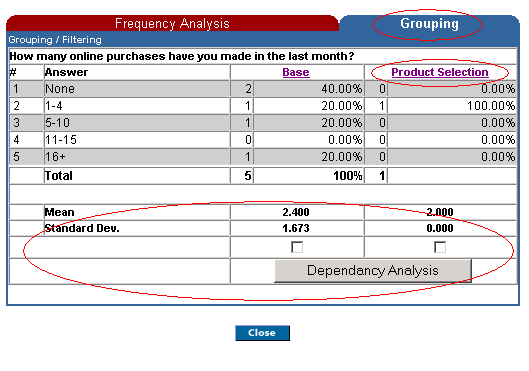
After creating the "Filters" or "Groups" you can click on all the Data Analysis links and view the frequency data filtered by the groups that you just created!
Enjoy slicing and dicing your data!